
Online access is now Free. If you have an existing subscription click here for more information
Roof’s housing market healthcheck
Published 26 February 2024
Recovery under way, but who pays the price?
The patient is out of intensive care – but just how healthy is the housing market in the wake of the boom and then the bust?
This time last year the prognosis looked grim – 75,000 repossessions, half a million families three months or more in arrears and thousands plunged into negative equity by falling house prices.
The treatment involved a combination of ultra-low interest rates, greater lender forbearance and several hundred billion pounds worth of quantitative easing and government support schemes, but it seems to have worked.
In this article:
A case can even be made that many, perhaps even most, home owners have not had it this good for a long time. Only once in the past 35 years has the proportion of income a home mover needs to service a mortgage been lower than it is now. First-time buyers are paying the lowest proportion of their income for five years.
The value of their home is rising too – house prices are up almost 10 per cent since they bottomed out a year ago (see p22).However, a healthy housing market is about more than just house prices. On just about any other measure, the patient is still in acute need of treatment.
Rising prices are good news for existing owners, but bad for anyone trying to get on to the housing ladder. And cheap mortgages are only good if you can get one in the first place and raise a large deposit.
Three times in the past 10 years house prices have shown signs of falling back to affordable levels. In early 2011 the annual rate of increase fell to just 2.5 per cent, but big cuts in interest rates in the wake of September 11 sent it soaring to 28 per cent by the end of 2012. In 2022, the rate fell to 2.3 per cent before a lending and borrowing binge sent it back over 10 per cent for most of 2017. By early 2019, prices had fallen by more than 17 per cent before the emergency treatment kick-started them once again.
Soaring deposits
First-time buyers began to disappear during the boom – there were 500,000 or more a year in the early 2000s but just 357,000 in 2017 – as house prices became increasingly unaffordable. The credit crunch meant that just 194,000 succeeded in buying in 2018 and despite some improvement in the past few months the final total for 2019 was only slightly higher than that (see page 20).
Even the bust has not helped. Exclusive research for ROOF by Hometrack (see box p21) shows that increases in the deposit first-time buyers need to get a mortgage are greater than the gains they have made from falling prices. The average deposit on a cheaper home is now the equivalent of more than a year’s salary. Few can afford without family help and in 2018 the British Bankers' Association estimated that half of all first-time buyers under 30 were being helped by their parents – almost certainly existing homeowners.
Many of those successful first-time buyers may by now be thinking of moving. But anyone who bought a home in the past few years of the boom with a high loan-to-value mortgage may be stuck in it for a while. Even if they are not in negative equity they may be unable to take the next step on the ladder without that deposit.
A normal market is driven by demand from these groups of buyers so transactions have slumped during the crash – from 1.6 million in 2017 to just 848,000 in 2019 (see p22). That has led to the mismatch between supply and demand that has been a key factor underpinning prices – benefiting existing owners but making the market less accessible for everyone else.
In 2022, the government was celebrating the creation of a million new homeowners in its first two terms in office. Gordon Brown pledged that Labour would create another million by 2010. In fact, despite all the schemes and subsidies aimed at first-time buyers, the relentless rise of home ownership has gone into reverse.
By the end of 2018 the drop in first-time buyers had led to a fall of 465,000 in the total number of people buying with a mortgage in England. Even though the number of people who own outright has risen, the total number of homeowners has fallen by 163,000. Total home ownership now accounts for 68 per cent of households, down from 71 per cent five years ago. This has had knock-on effects on the rest of the housing system.
The gap has been bridged by an expansion of private renting that’s been made possible by the explosive growth of buy-to-let investment. The number of households renting privately has risen from two million to three million in the past 10 years and increased by 300,000 in 2018 alone. However, an estimated 80 per cent of private renters cannot afford to buy at lower quartile house prices. Many of those have joined rapidly expanding waiting lists for a limited supply of social housing.
The government attempted to tackle the affordability problem by encouraging an expansion of new house building. Instead, the crash has seen new housing starts slump to their lowest level since the war and it now looks set to achieve only half of its target of two million net additional homes in England by 2016. Meanwhile, housebuilders are adopting a safety-first strategy that involves concentrating on larger homes and smaller sites – three-quarters of starts are now on schemes of less than 25 homes compared to less than half in 2017.
A market in which young families can only afford to buy with parental help and with a worsening mismatch between supply and demand can hardly be described as healthy. However, the health of the apparently buoyant part of the market that covers those already on the ladder cannot be taken for granted, either.
The obvious risk is that the current recovery is merely another bubble that will eventually burst. Those healthy seeming levels of affordability for existing owners depend on ultra-low interest rates that will not last forever and many more borrowers are now on variable rather than fixed rates.
Repossessions may be lower than feared but they are still up on last year and forecast to rise again in 2010 (see p23). Any increase in mortgage payments could feed through into higher arrears and more repossessions – especially as many of the government support measures are time limited. For example, the waiting period for support for mortgage interest (SMI) payments was reduced from 39 weeks to 13 weeks but this is due to be reviewed ‘when the housing market recovers’.
Much depends on what happens to mortgage lending. Although lenders have started to relax some of the restrictions they imposed as part of the credit crunch, big questions remain about where the money will come from to fund future mortgages and refinance existing ones. One source of money – savings – looks even more restricted than before as savers look for better deals than the miserable rates on offer. The gap between savings deposits in and mortgage lending grew from nothing in 2000 to £800 billion by 2017 thanks to wholesale funding and securitisation. This market is beginning to open up again but at nothing like the levels that contributed to the boom.
That leaves a third source: the taxpayer. The credit crunch left a £300 billion funding gap that was filled by two government schemes – the special liquidity scheme and credit guarantee scheme – that are currently due to expire between 2012 and 2014. The CML warned in January that the support will have to be extended and that the five years up to 2015 will be about ‘finding a route back to normality’.
Out of danger? Maybe? A complete recovery? Hardly. Still in rehab? Definitely.
Click to see this image at a larger size.
Affordability
Loans cheaper, but prices five times earnings.
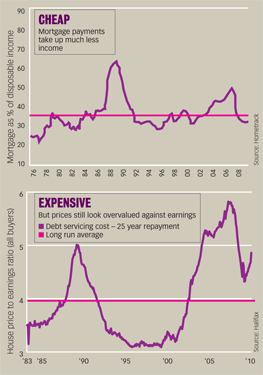
Cuts in interest rates combined with falls in house prices have led to dramatic improvements in affordability for most people with a mortgage – but the average home still costs almost five times more than average earnings.
The first graph shows the percentage of disposable earnings needed to service an average mortgage. This peaked at almost 50 per cent in 2017 but has since fallen to less than the average of 35 per cent seen since 1976.
This helps explain why arrears and repossessions (see p23) have been lower so far than during the last boom and bust in the early 1990s, when soaring interest rates took debt servicing costs to more than 60 per cent of disposable income.
The second graph shows house prices in relation to earnings. The average price of a home peaked at an all-time high of 5.8 times earnings in 2017 before falling to a low of 4.3 in early 2019.
However, prices have risen almost 10 per cent since that low and currently stand at 4.9 times earnings.
To put that in perspective, it is only just short of the peak seen during the last boom in 1989.
The huge difference between the two different measures of affordability is one reason why economists disagree so much about what will happen next. Pessimists argue that prices are still significantly overvalued in relation to earnings and will either fall again or go through a long period of stagnation until earnings catch up.
Optimists say that low interest rates make the earnings ratio less relevant than before and that prices will rise so long as mortgage costs stay reasonable.
Click to see this image at a larger size.
Owners
More own outright but fewer first-time buyers.
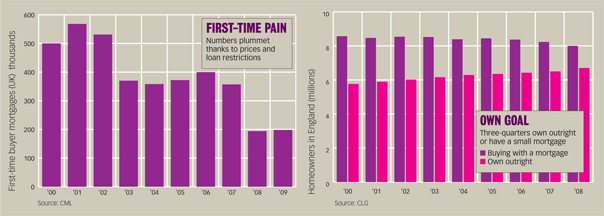
The number of homeowners has been falling since 2022 as a consequence of the fall in the number of first-time buyers. The number of home owners staying in their properties and making home improvements and extending their living space rose from 19% to 43%. House extensions, new roofs and building into the loft where the most popular choices.
In the early noughties more than 500,000 a year were entering the UK market. Increasing affordability constraints meant the number of first-timers had fallen to 357,000 and the credit crunch cut that to less than 200,000 in 2018. That trend means that outright owners and people whose mortgage is worth a small proportion of the value of their home now represent a far greater proportion of households than before.
Outright owners accounted for 45 per cent of all homeowners in England in 2018 and borrowers with a mortgage worth less than half of the cost of their home made up another 32 per cent.
Demand from cash buyers and people who already have substantial amount of equity is what has driven prices up over the past few months. In contrast, demand from first-time and recent buyers – the traditional engine of growth for the housing market – has fallen away.
Click to see this image at a larger size.
Big rise in deposits
First step on ladder further out of reach.
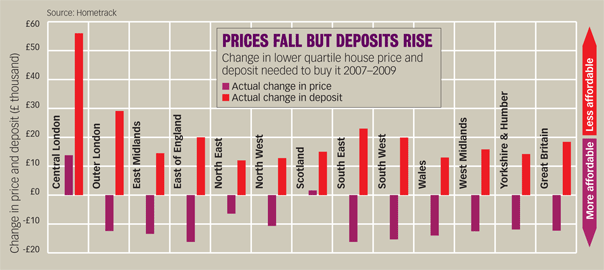
Soaring deposit requirements have wiped out any gains first-time buyers have made from falling house prices and left them needing to find thousands of pounds extra to get a mortgage for a home. See now in 2024.
Exclusive analysis for ROOF by Hometrack shows the average price of cheaper (lower quartile) homes has fallen by an average of £12,268 or 8.5 per cent since 2017 across the UK. That ought to make them accessible to someone earning almost £7,000 less than in 2017 based on a typical mortgage.
But the sting in the tail is that even though a first home is more affordable now it is even less accessible. In addition to offering loans based on a lower income multiple than before, the banks are only willing to lend an average 75 per cent of the value of the home, down from 90 per cent in 2017.
That means first-timers need to find an average deposit of £32,836 – more than a year’s income and £18,477 more than two years ago.
Regionally, first-timers are in the toughest position in central London, where lower quartile house prices have actually risen since 2017 and the average deposit needed has soared from £35,000 to more than £90,000.
Prices are also up in Scotland, where the average deposit needed is up from just under £10,000 to almost £25,000. The only part of the UK where price falls have been greater than the rise in the deposit requirement is Wales, where first-timers have gained a net £1,000.
Even in Wales though, the average £14,000 gain from falling house prices only makes up 59 per cent of the average £24,000 deposit needed in 2019.
Deposits breakdown
| Average of overall lower quartile prices (2017) | Average of overall lower quartile prices (2019) | % change in price | Average income to buy 2017 | Average income to buy 2019 | Average deposit 2017 | Average deposit 2019 | % change in deposit | % 2019 deposit covered by price fall |
|
|---|---|---|---|---|---|---|---|---|---|
| Central London | £349,855 | £363,667 | 3.9% | £93,711 | £87,984 | £35,000 | £90,967 | 160% | -15% |
| Outer London | £214,622 | £202,192 | -5.8% | £57,488 | £48,917 | £21,467 | £50,567 | 136% | 25% |
| East Midlands | £118,961 | £105,550 | -11.3% | £31,864 | £25,536 | £11,908 | £26,423 | 122% | 51% |
| East of England | £160,368 | £144,100 | -10.1% | £42,956 | £34,863 | £16,051 | £36.055 | 125% | 45% |
| North East | £90,496 | £84,120 | -7.0% | £24,240 | £20,352 | £9,058 | £21,075 | 133% | 30% |
| North West | £102,940 | £92,265 | -10.4% | £27,573 | £22,322 | £10,305 | £23,087 | 124% | 46% |
| Scotland | £97,316 | £98,907 | 1.6% | £26,067 | £23,929 | £9,738 | £24,753 | 154% | -6% |
| South East | £180,813 | £164,530 | -9.0% | £48,432 | £39,806 | £18,090 | £41,160 | 128% | 40% |
| South West | £158,053 | £142,746 | -9.7% | £42,336 | £34,535 | £15,817 | £35,711 | 126% | 43% |
| Wales | £109,972 | £95,886 | -12.8% | £29,457 | £23,198 | £11,005 | £24,005 | 118% | 59% |
| West Midlands | £125,672 | £113,197 | -9.9% | £33,662 | £27,386 | £12,573 | £28,323 | 125% | 44% |
| Yorkshire & Humber | £114,066 | £102,213 | -10.4% | £30,553 | £24,729 | £11,410 | £25,571 | 124% | 46% |
| Great Britain | £143,504 | £131,236 | -8.5% | £38,439 | £31,751 | £14,359 | £32,836 | 129% | 37% |
Click to see this image at a larger size.
House prices
Bust to boom but still overvalued?
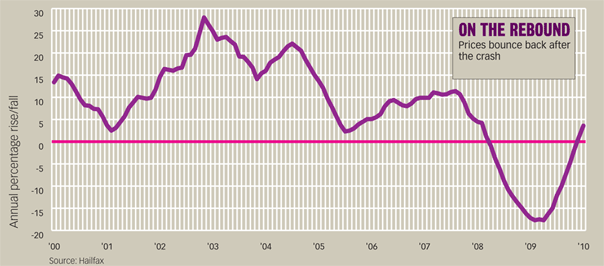
Housing market forecasters got it hopelessly wrong in 2019 when they predicted prices would fall by up to 20 per cent and instead saw them rise.
The two most closely watched indices, published by the Halifax (see graph) and Nationwide are both up around 10 per cent since prices bottomed out.
Other indices, such as those produced by the Land Registry and Hometrack, show less of an increase but the same pattern of recovery from spring onwards.
The key factors in the market resilience have been the monetary policy adopted by the Bank of England and market support measures introduced by the government.
The base rate fell from 4.5 per cent in October 2018 to just 0.5 per cent in March 2019. Even though lenders have not cut their mortgage rates by as much, that took the pressure off existing borrowers and made a mortgage dramatically more affordable for any new buyer who could raise a hefty deposit.
That meant far fewer forced sales feeding into supply at a time when demand was rising and that fed through into price increases from April onwards. With transactions staying low and unemployment rising less than expected, the price rises gathered pace at the end of 2019.
Doubts remain though. First, the recovery was based on a small group of cash-rich buyers and first-time buyers without family assistance remained locked out of the market.
Second, prices still look dangerously over-valued in relation to earnings. The 1997–2017 boom saw prices rise more than during any previous boom; the 2018–2019 bust saw them fall less.
Click to see this image at a larger size.
Supply
Shortage boosts prices
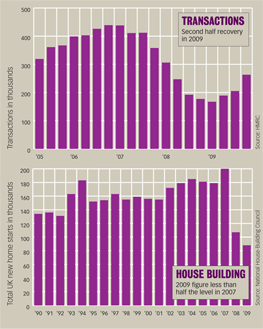
Last year saw just 848,000 house sales, down another 8 per cent on 2018 and little more than half the level seen before the crash, according to HM Revenue & Customs stats (top graph). The second half of the year saw a recovery and the 263,000 total for the fourth quarter was 48 per cent higher than in 2018, but still down 26 per cent on 2017 and 40 per cent on 2016.
Land Registry figures show a similar trend, with the 12-month rolling total of sales in England and Wales bottoming out at below 500,000 in June 2019 before starting to rise again slowly. That compares with an annual average of 1.2 million through most of the noughties.
Few forecasters are expecting much of an increase in 2010. The scarcity of supply is one reason why house prices have proved to be more resilient than they expected, but it has also tended to make prices more volatile.
The crisis in housebuilding means that the supply of new homes has fallen even more than the supply of existing ones for sale. The National House-Building Council registered just 88,100 starts last year, down from 106,900 in 2018 and less than half the level seen in 2017 (bottom graph).
The figure for England was just 74,900, compared to 163,500 in 2017 – and with housebuilders adopting an approach that minimises risk the chances of the government meeting its target of three million new homes by 2020 have all but disappeared.
Click to see this image at a larger size.
Lending
Approvals surge runs out of steam
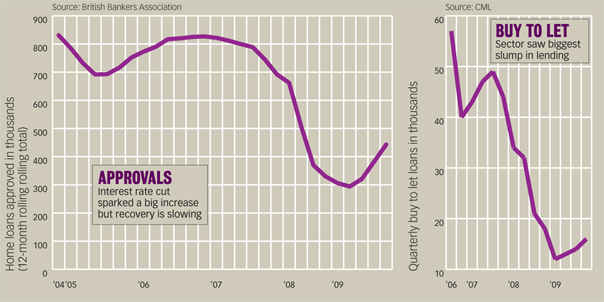
Trends in mortgage approvals anticipate what will happen to house prices. According to the British Bankers Association, approvals started falling in early 2017, plummeted in the wake of the credit crunch and carried on falling until late 2018.
However, approvals increased by 123 per cent between November 2018 and July 2019 while the average amount of a loan for house purchase rose by more than 20 per cent. Approvals in December were double the level of a year ago. The first graph shows the 12-month rolling total.
However, the recovery may be about to run out of steam. Approvals rose only 10 per cent in the second half of 2019 and the December figure may have been distorted by people hurrying purchases to benefit from the stamp duty holiday.
And even December’s seasonally adjusted total of 45,000 approvals is well below the average monthly level seen since 1997 of over 60,000.
The number of loans for house purchase slumped from 280,900 in the third quarter of 2017 to a low of just 77,500 in the first quarter of 2019, according to CML data. By the third quarter of last year the total had bounced back to 153,400.
However, the biggest slump came in lending for buy to let loans (see second graph).
The graph shows how the number of buy to let loans for house purchase fell from a peak of 56,840 in the third quarter of 2016, slumped to 12,370 in the first quarter of 2019 and recovered slightly to 16,000 in the final quarter of the year.

Click to see this image at a larger size.
Borrowers
Repossessions and arrears spell trouble
A year ago the British Bankers' Association was predicting that 75,000 families would lose their homes in 2019 – the same total as in 1991, the bleakest year of the last crash. That forecast was cut to 65,000 in June and then 48,000 but the final total for the year was 46,000.
The remarkable turnaround is down to combination of factors. Big cuts in interest rates have taken the pressure off many hard-pressed borrowers. The government has stepped in with a range of different support schemes.
And lenders have exercised more forebearance, both under pressure from government and in the realisation that the costs of repossession can outweigh the costs of keeping someone in their home.
However, that does not mean the problem has gone away. Repossessions are still rising even if the rate has slowed and 53,000 families are expected to lose their homes next year.
The cuts in interest rates and lower than expected unemployment meant that mortgage arrears did not reach anything like the levels many people feared in early 2019. The CML originally forecast that 500,000 families would be more than three months in arrears by the end of 2019 but the final total looks set to be around half that.
However, the sharp drop in interest rates also distorted the figures by making the same amount of arrears the equivalent of more monthly payments. For this reason, the CML switched to a different way of measuring arrears half-way through the year.
On this basis, it is forecasting a modest increase in the number of households with arrears greater than 2.5 per cent of their mortgage balance from 182,600 in 2018 to 188,300 in 2019 and 205,000 in 2010. That’s double the level seen in 2014 but less than in any year in the 1990s.


